This vignette is intended to demonstrate the breadth of
scale_duke_continuous() and its various applications. It is
fully integrated with ggplot2 visualizations.
Plot Examples
For these visualizations, we will use the penguins
dataset from the palmerpenguins package.
Scatter Plots
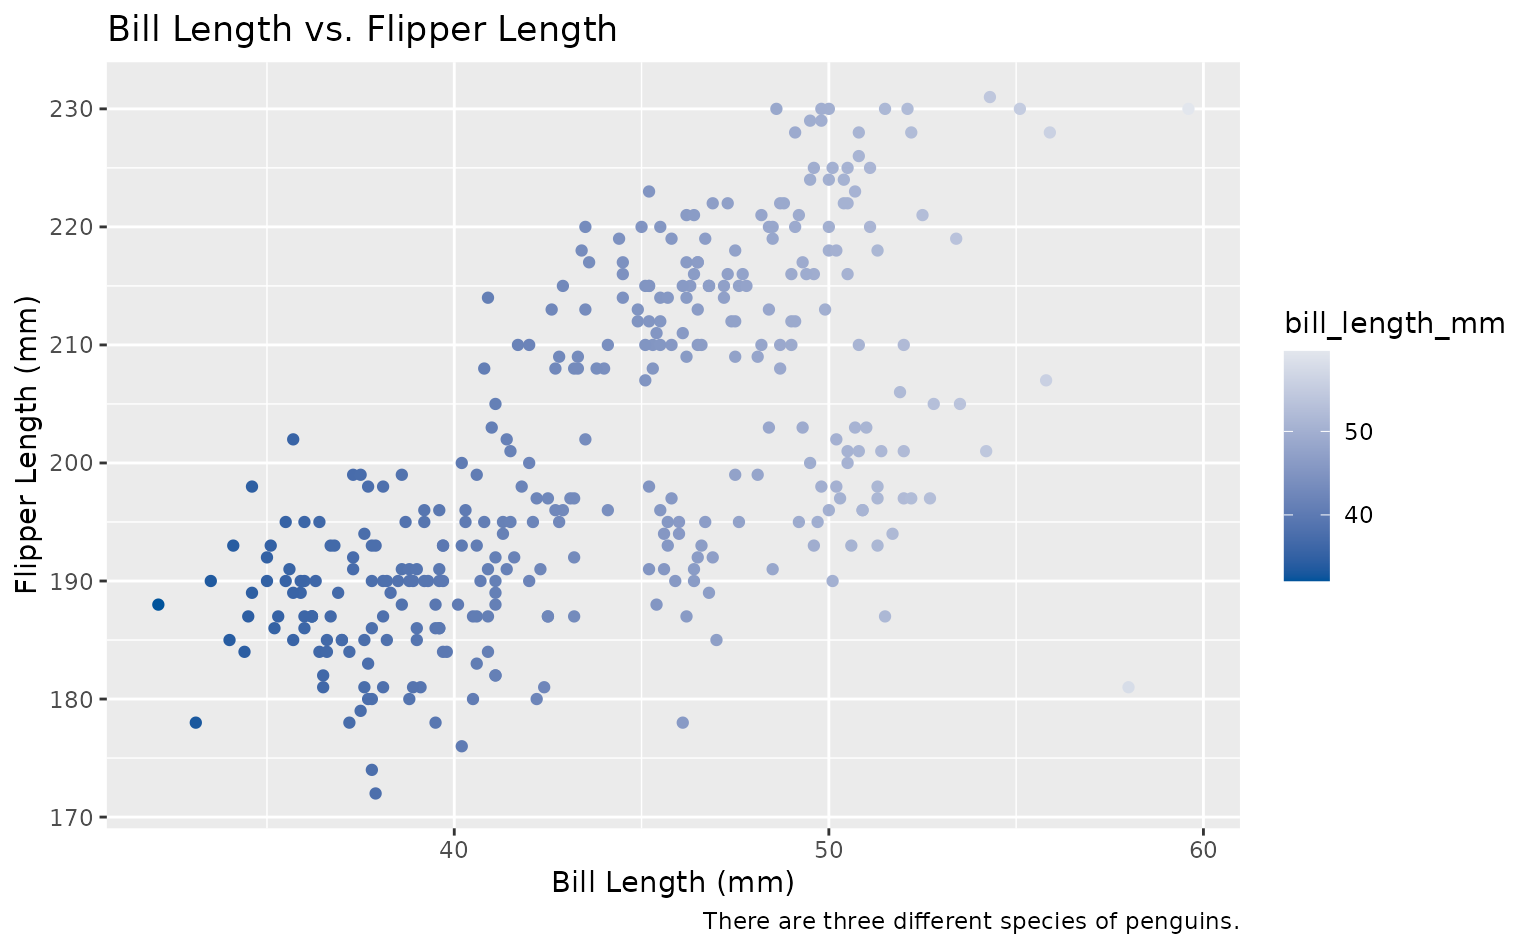
plot <- ggplot2::ggplot(palmerpenguins::penguins, ggplot2::aes(bill_length_mm, flipper_length_mm)) +
  ggplot2::geom_point(ggplot2::aes(colour = bill_length_mm)) +
  ggplot2::labs(title = "Bill Length vs. Flipper Length", caption = "There are three different species of penguins.", x = "Bill Length (mm)", y = "Flipper Length (mm)")

plot +
  scale_duke_continuous()