![]()
Overview
duke allows users to generate visualizations with Duke’s official suite of colors in a color blind friendly way. By using it alongside ggplot2, you can easily promote accessibility in the Duke community and beyond.
Installation
You can install the official version of duke from CRAN with:
# Install duke directly:
install.packages("duke")
Or alternatively, you can install the development version from GitHub:
# install.packages("devtools")
devtools::install_github("aidangildea/duke")
Usage
This package is fully integrated with ggplot2, and therefore, allows you to customize several visualization features such as the theme and color scales of your plots created with ggplot2.
Example
By using duke functions, you can easily convert your visualizations to Duke official colors.
library(ggplot2)
library(duke)
plot1 <- ggplot(mpg, aes(cty, hwy)) +
geom_point(aes(colour = fl)) +
labs(
title = "City Miles per Gallon vs. Highway Miles per Gallon By Fuel Type",
caption = "Data sourced from mpg in ggplot2 package.",
x = "City Miles per Gallon (MPG)",
y = "Highway Miles per Gallon (MPG)"
)
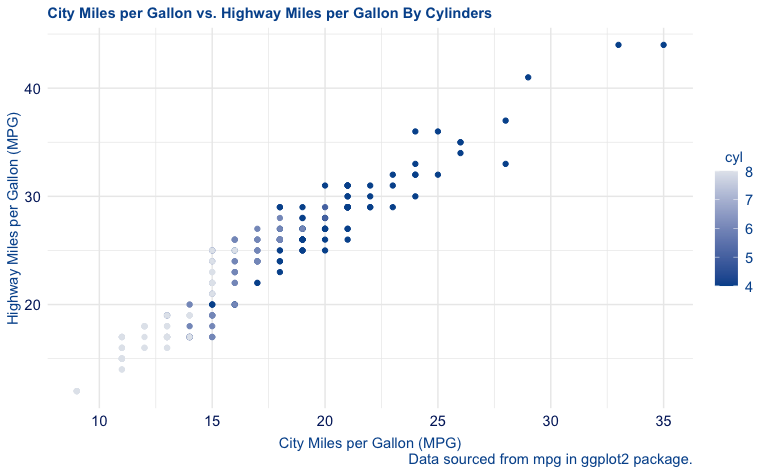
plot2 <- ggplot(mpg, aes(cty, hwy)) +
geom_point(aes(color = cyl)) +
labs(
title = "City Miles per Gallon vs. Highway Miles per Gallon By Cylinders",
caption = "Data sourced from mpg in ggplot2 package.",
x = "City Miles per Gallon (MPG)",
y = "Highway Miles per Gallon (MPG)"
)Then, by pairing them with functions from this package, you can convert them into Duke-branded and colorblind-friendly versions.
plot1 +
  theme_duke() +
  scale_duke_color_discrete()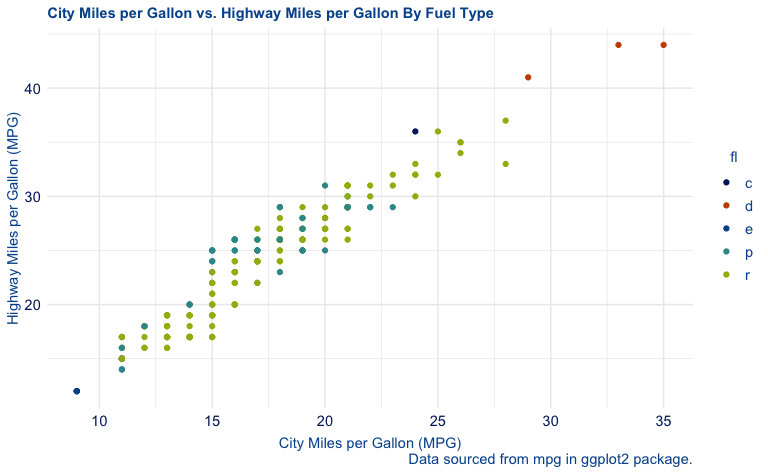
plot2 +
  theme_duke() +
  scale_duke_continuous()